![Cardano Technical Forecast, Charts: ADA Price Prediction, Strategy For "Lazy" Trading [Video] – Exchange Rates UK](http://jaytalkscrypto.com/wp-content/uploads/2021/03/cryptocurrency-4-m.jpg)

Tezos (XTZ)

Above: Tezos (XTZ) Daily Chart
Tezos has fallen as much as any other major altcoin over the past few days. The trick, now, is to determine which direction a trade can be taken. The first thing to always look for is the trend – which is bullish. We also need to see how long the trend has been moving and if there has been an extension in that upward move without a pullback or a corrective move. From the previous all-time high at 7.75 to the sell off low at 4.912, Tezos dropped more than -36%. -36% is more than sufficient to qualify as a pullback and a corrective move – the time it spent in that move doesn’t matter. For the long/buy side of the market, I am looking to buy if we get a close above the daily with an entry around the 6.00 value area, a stop at 5.56 and an initial profit at 8.25. On the short side of the market, I want to see a daily close below the April 19th low of 5.23 with a stop at 5.75 and an initial profit target at 4.21.
Bitcoin (BTC)
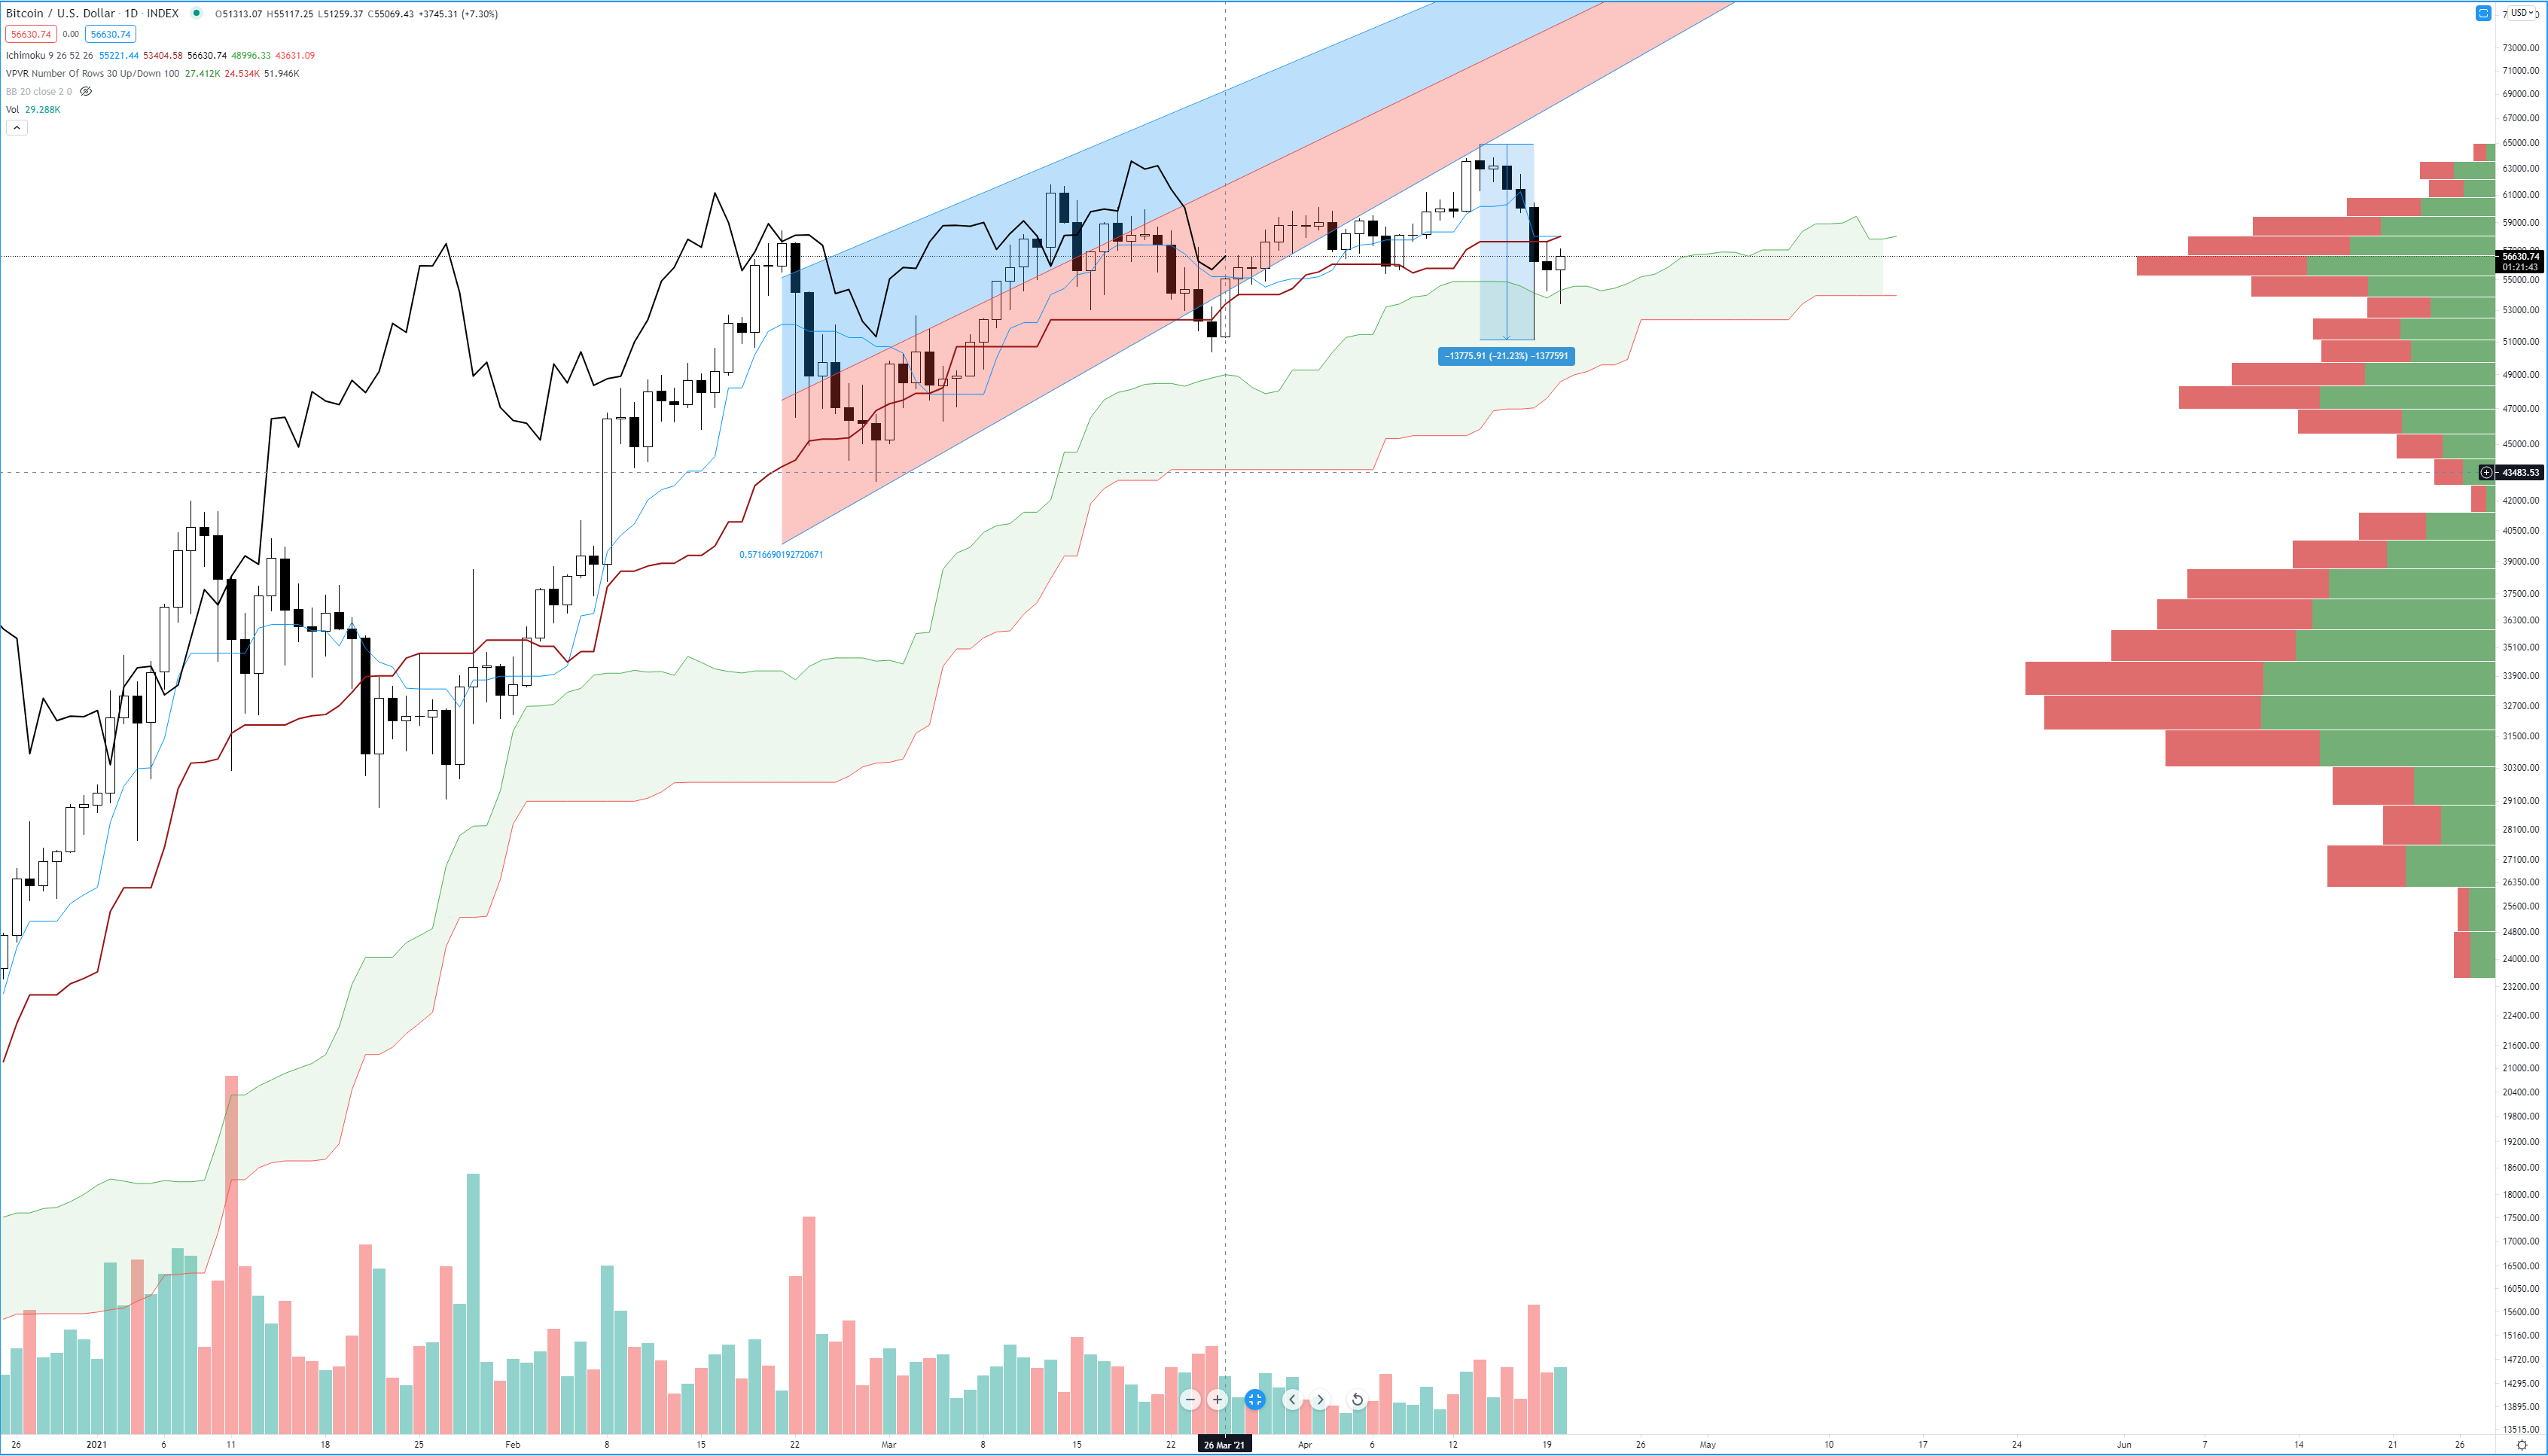
Above: Bitcoin (BTC) Daily Chart
The channel on Bitcoin’s chart above is a regression channel drawn from the swing high on Februart 21st to the next higher high on March 13th. Observe how Bitcoin and the bulls attempted to push Bitcoin back into that channel over the course the past sixteen days. However, When Bitcoin tagged a new all-time high on April 14th, we’ve seen Bitcoin continue to move lower and ultimately drop -21.23% from the all-time high 51,120.15. Using the Ichimoku system as we did in with Tezos – I am looking to re-enter a long/buy when we get a daily close above the Tenkan-Sen and Kijun-Sen. For long setup, my entry would be around the 58310 value area with a stop just below Senkou Span A at 53902 and a profit target at 69600, just below the regression channel. For the short setup, I want to see a close below the prior swing low at 51620 with a stop loss slightly above Senkou Span A. The profit target for the short entry is at 40000.
Cardano (ADA)

Above: Cardano (ADA) Daily Chart
Cardano’s chart shows us exactly the kind of condition we wanted to see for entering a long setup. Unless something drastic changes in the next hour (1900 EST), we should see Cardano have a clear bullish close above all three trendlines in the bullish pennant above. Aggressive buyers could enter at the market as long as the close is above 1.26, but I would look for confirmation of support and a resumption of the uptrend. Which means I want to see a close above the Tenkan-Sen and Kijun-Sen at 1.30. My stop loss on that buy entry would be slightly below the pennant at 1.0875 – 1.10 and my profit target would be slight above the breakout of the pennant at 1.57. I am equally interested in a short opportunity, too. I don’t want to see just a close below the trendlines, but a close below Monday’s low (1.1626). That would bring price below the nearest high volume node and could kick off a nice spike south towards the next high volume node (and short profit target) at 0.90. My stop loss on the short trade is at 1.2188.
Advertisement
Save money on your currency transfers with TorFX, voted International Money Transfer Provider of the Year 2016 - 2020. Their goal is to connect clients with ultra competitive exchange rates and a uniquely dedicated service whether they choose to trade online or over the telephone.
Find out more here.


