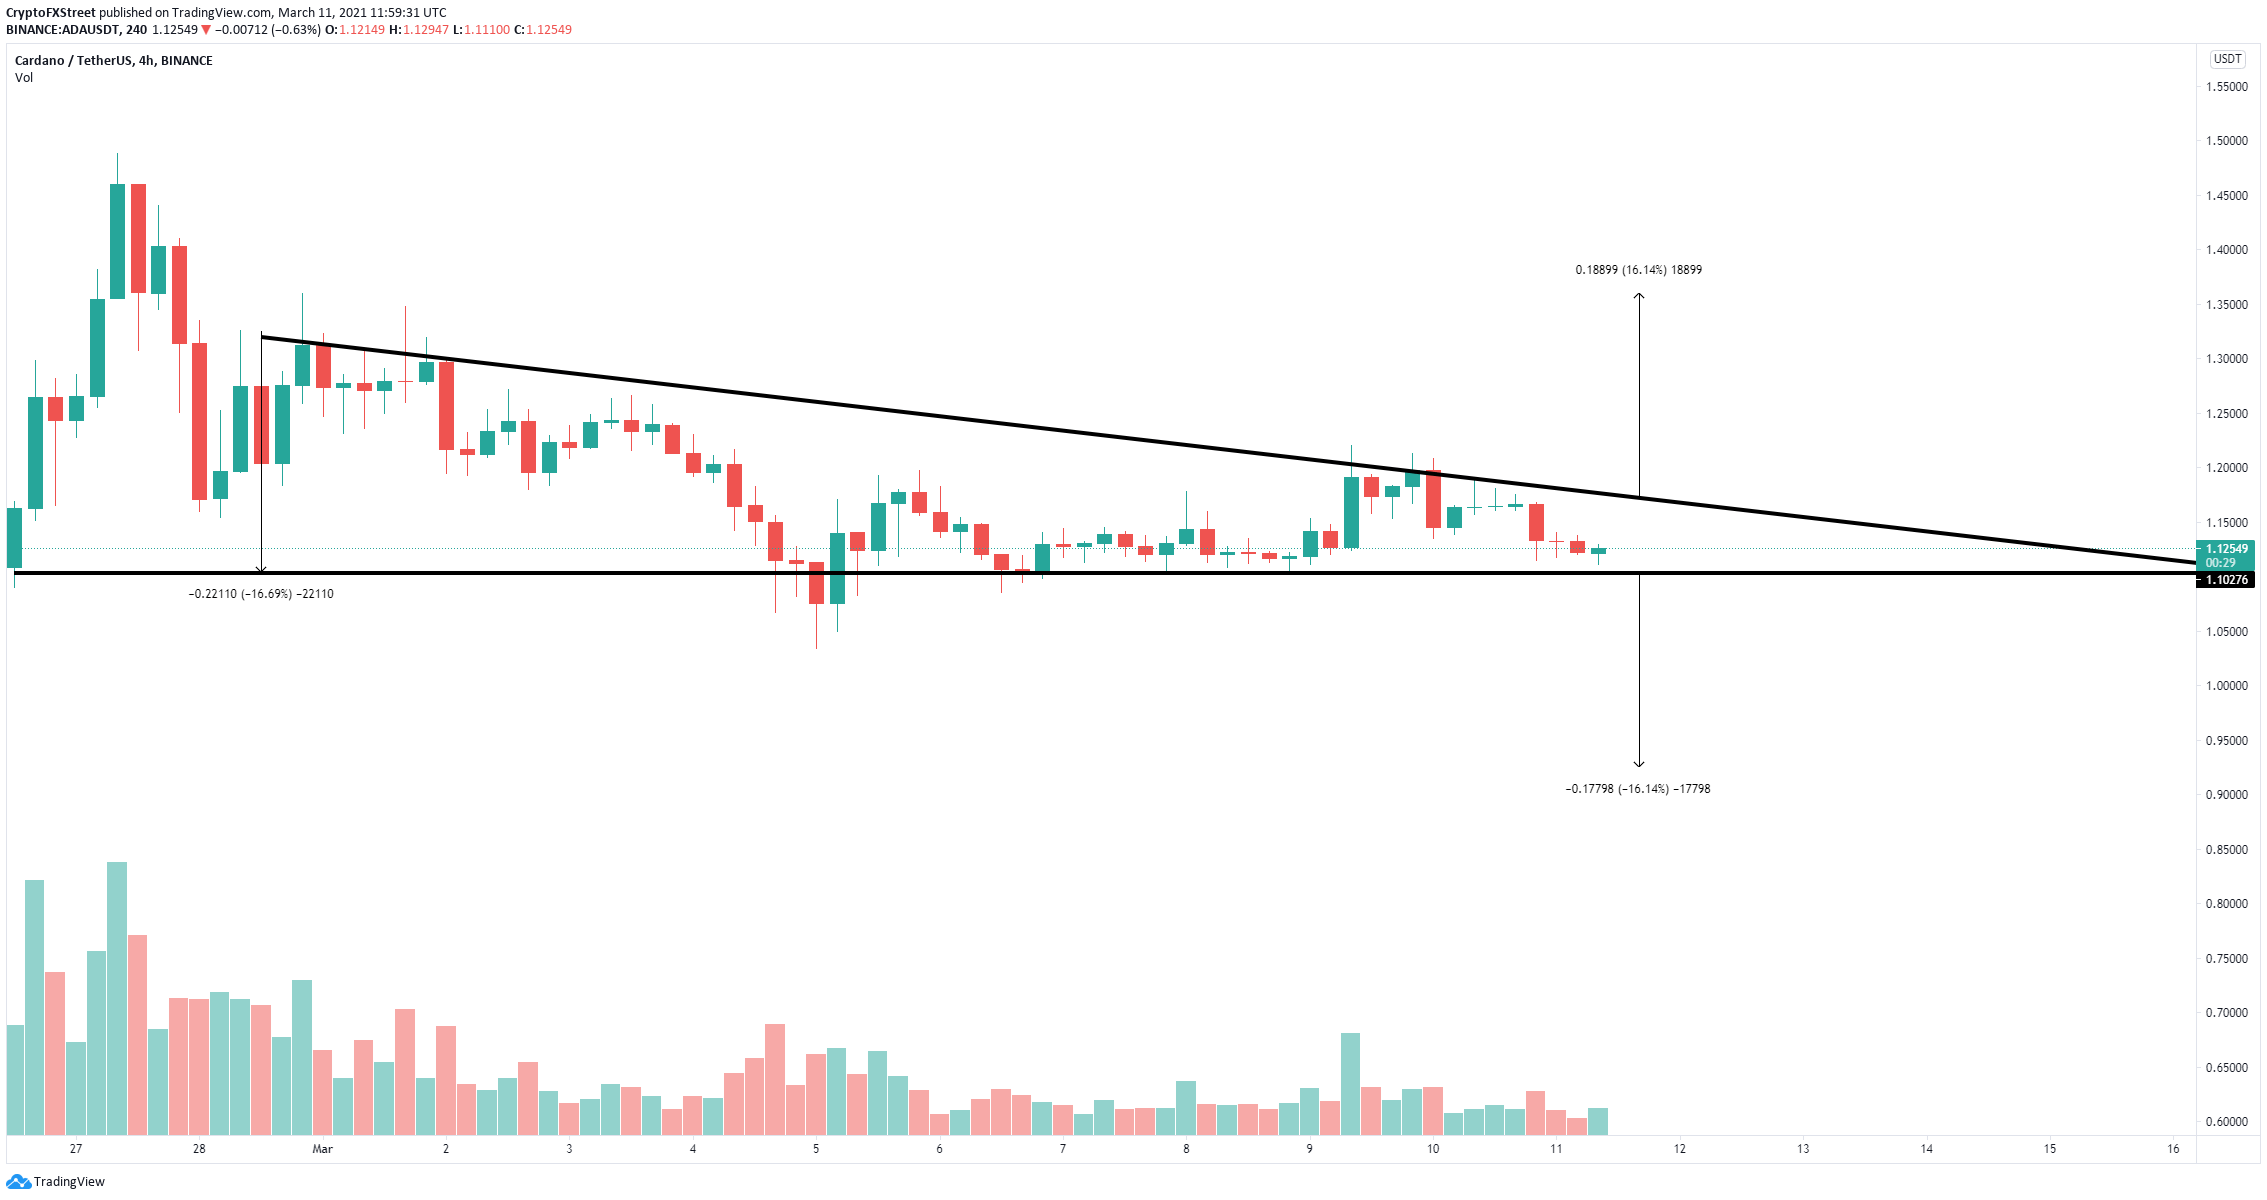
- Cardano price is contained inside a descending triangle pattern.
- Bulls must hold a key support trendline to avoid a significant fall.
- On the other hand, ADA could also be on its way to new all-time highs.
Cardano has been trading sideways for the past week and must defend a critical support level yet again. Failure to stay above this point would lead ADA into a significant pullback below $1.
Cardano price at risk of a 16% drop
Cardano has formed a descending triangle pattern on the 4-hour chart. Buyers must hold the crucial support trendline at $1.10 to avoid a 16% pullback towards $0.90.
ADA/USD 4-hour chart
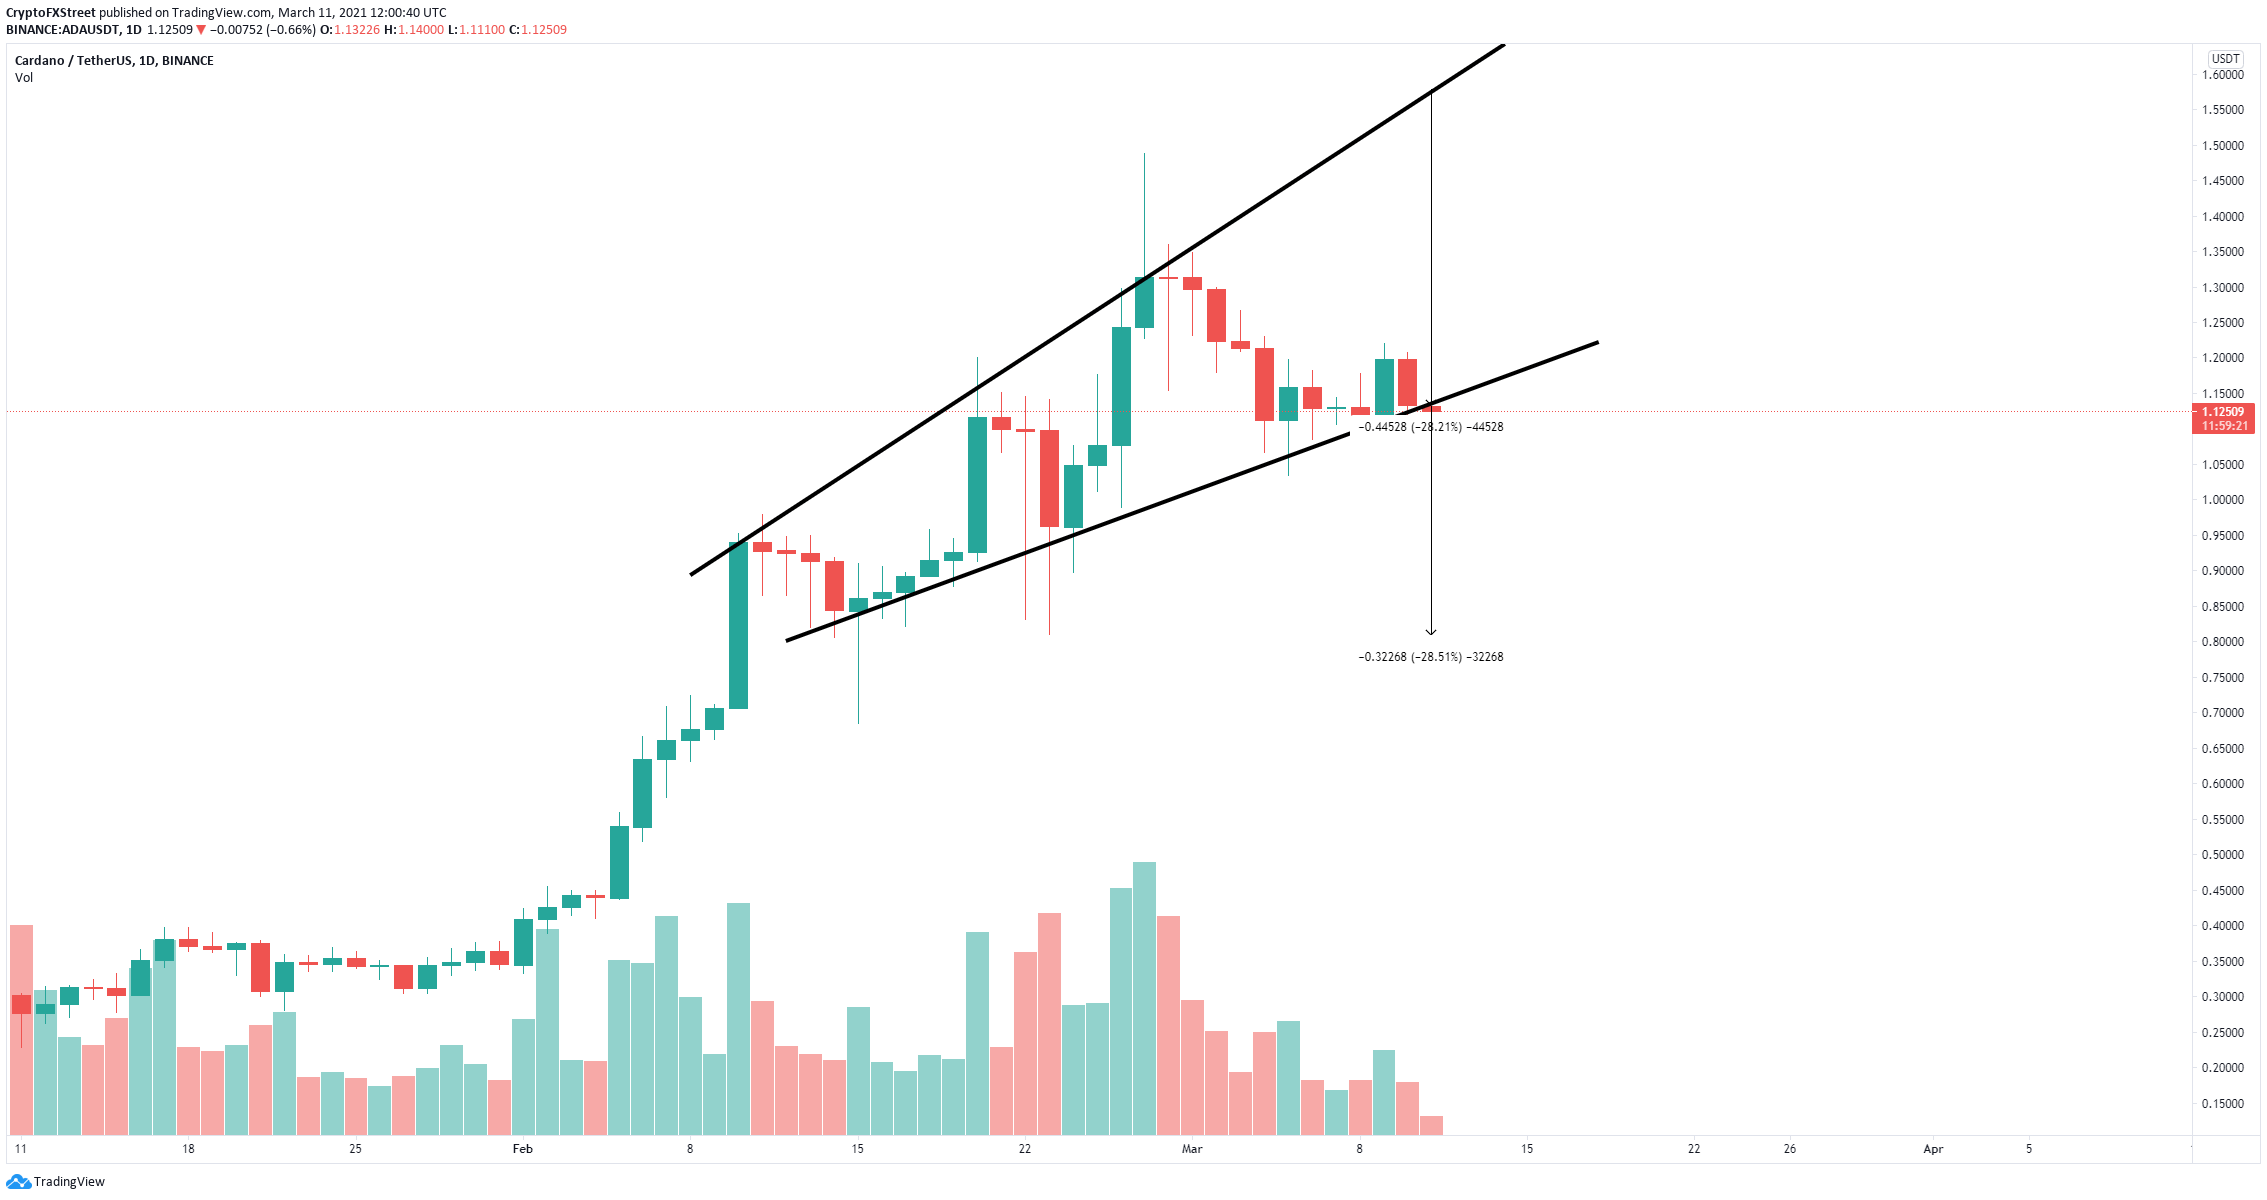
At the same time, this would also confirm a breakdown from the ascending broadening wedge pattern on the daily chart, which has a lower price target at $0.80.
ADA/USD daily chart
To invalidate the bearish outlook, Cardano must climb above $1.10 convincingly. A breakout above $1.17 would lead Cardano price towards a high of $1.35 from the descending triangle pattern formed on the 4-hour chart.


