- Cardano price releasing from a symmetrical triangle today on heavy volume.
- The seven-week consolidation says the market doesn’t believe ADA is overvalued.
- 2018 high of $1.40 remains a challenge for speculators after three failed weekly rallies.
Cardano price pattern has shifted from a pennant to a symmetrical triangle after the consolidation moves into the seventh week. The upside potential is now relatively muted compared to the pennant, but the outlook remains bullish for ADA.
Cardano price currently lagging broader cryptocurrency strength
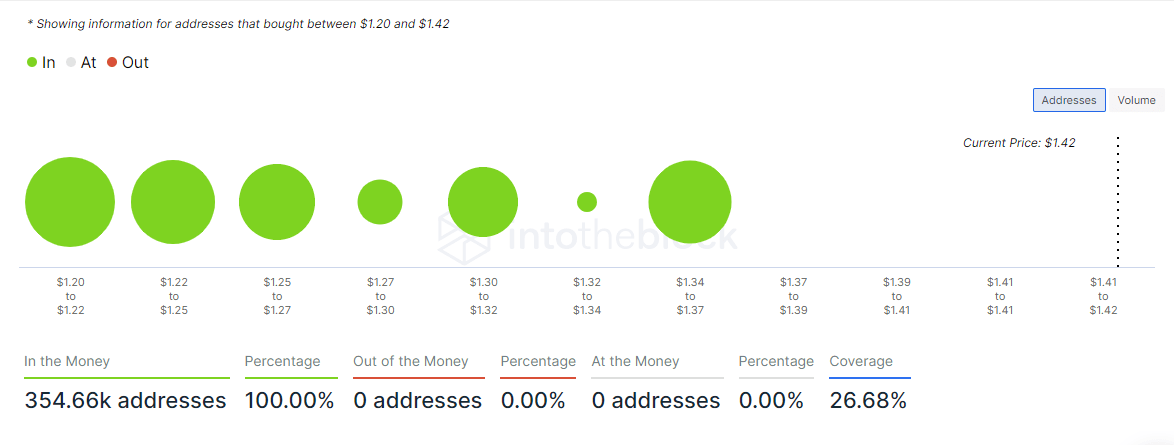
The IntoTheBlock In/Out of the Money Around Price (IOMAP) data reveals constructive support between $1.37 and $1.20 with 72.85k addresses buying 2.35b ADA in the range of $1.37 and $1.34. The range corresponds with the highs printed on March 20, March 26, and April 6.
ADA IOMAP chart
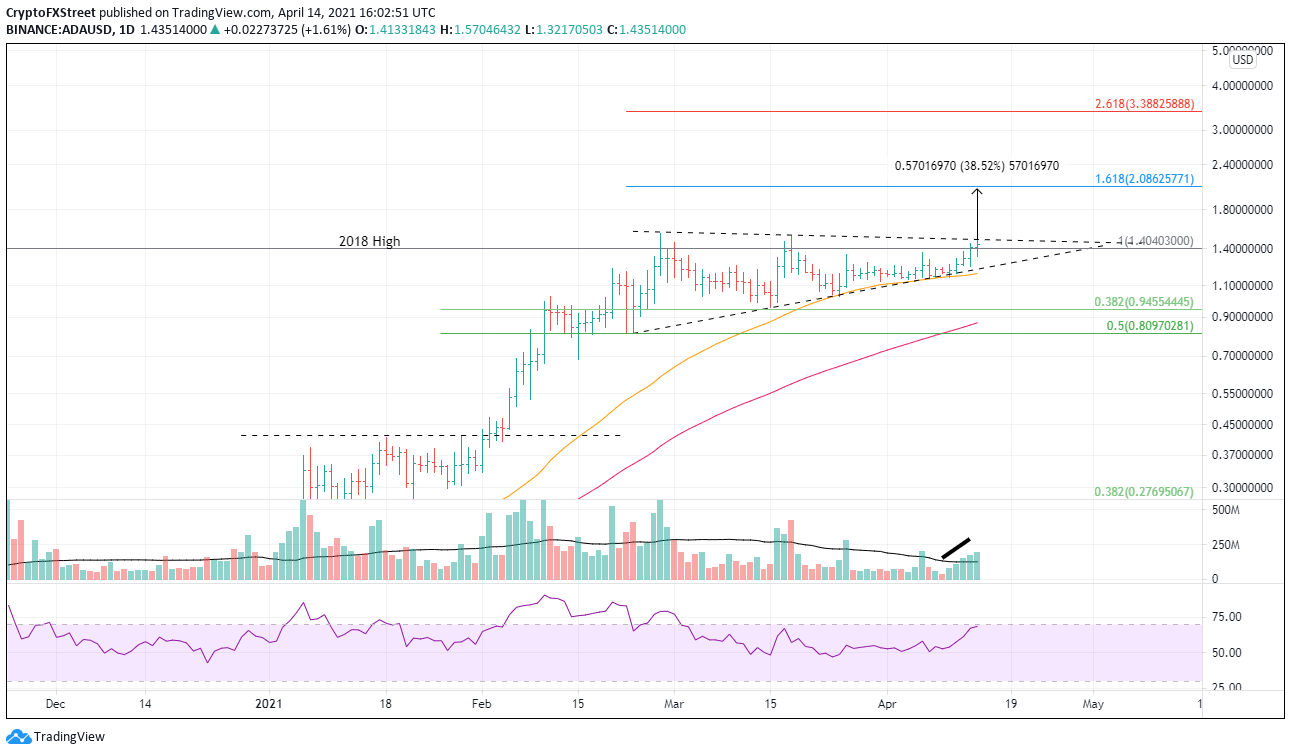
After 44 days, ADA is breaking out from a symmetrical triangle. The pattern projects a 38.5% gain from the declining trendline at $1.48, which equates to a price of $2.05 and is near the 161.8% Fibonacci extension of the March correction at $2.08.
If the rally gains traction beyond the $2.05-$2.08 range, ADA may rally to the 261.8% extension at $3.39.
ADA/USD daily chart
Of course, this new rally attempt above 2018 high, and the declining trendline may fail. Immediate, firm support emerges at the convergence of the rising trendline at $1.22 and the 50-day simple moving average (SMA) at $1.19.
Any further losses would discover support at the 38.2 retracement level of the February advance at $0.95 and then the 100-day SMA at $0.87.


