- Chainlink price collapse on March 22 broke significant support.
- Lack of buying intensity undermines credibility of the 20% rebound.
- Pivotal resistance above will determine price direction for the next 2-3 weeks.
Chainlink price rebound is compromised by the down-trending 21-day simple moving average (SMA) at $28.41 and the flattening 50-day SMA at $29.03. A breakout above the confluence of moving averages requires a more outstanding commitment than daily volume running at less than half the average. For now, the 20% rebound over the last five days has to be viewed as a corrective process of the extreme oversold condition shown on the 4-hour chart on March 24.
Chainlink price follows the broader strength in the cryptocurrency complex
The tag-along advance is consistent with weaker cryptocurrencies. Still, with ample resistance just above the current price level, traders should be preparing for a reassertion of the selling to carry LINK to the 100-day SMA at $23.55, a trend-spotting indicator that has not been tested in the first days of 2021.
The February 23 crash low at $21.00 is compelling price support and will ignite a bounce, but a bearish outlook needs to entertain the August 2020 high at $20.00 as the final resting place for LINK, yielding a loss of 29% from today’s price.
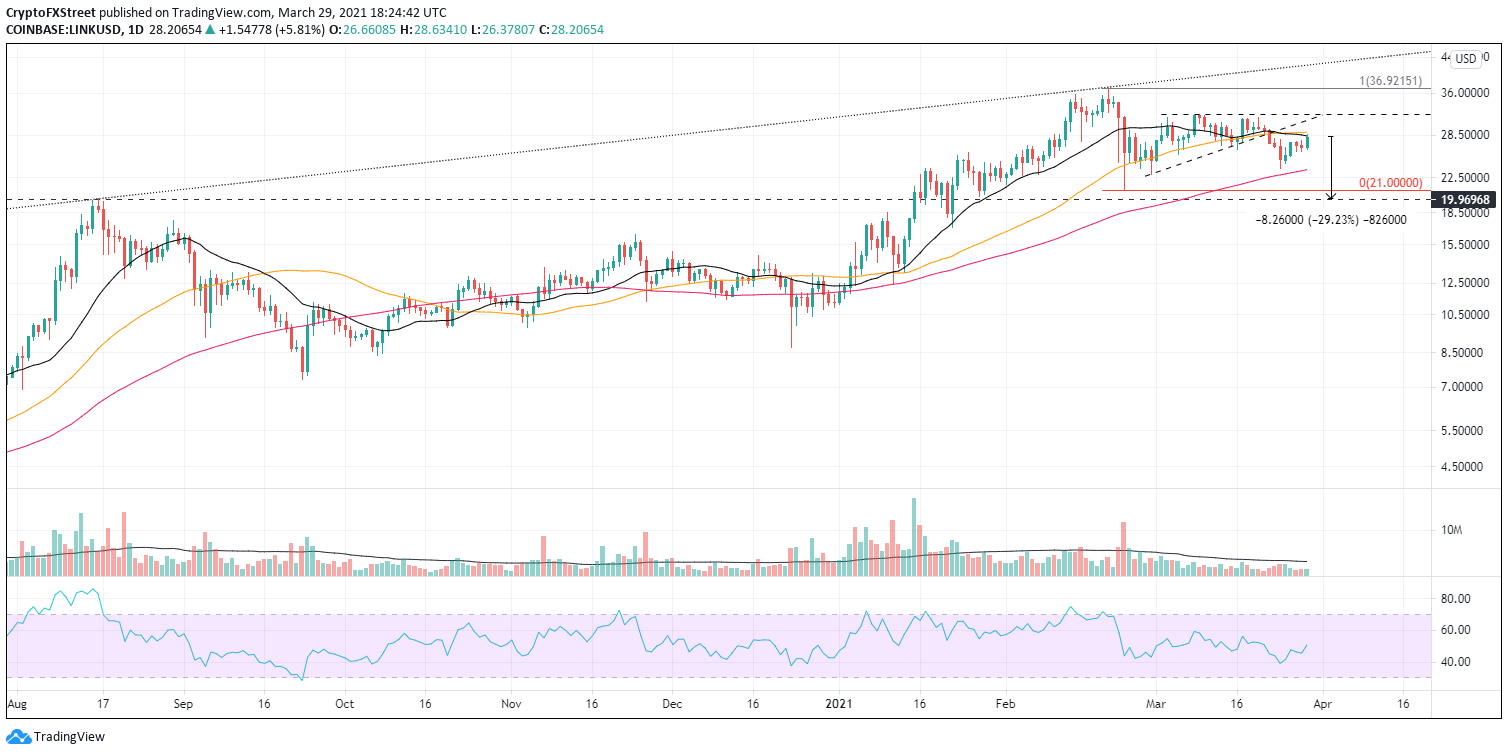
LINK/USD daily chart
If LINK can overcome the key moving averages’ resistance, it will empower the altcoin to test the March 9 high at $32.00. A breach will put the February 20 high at $36.92 in the crosshairs of the bulls.


